Returning business systems to full operational capacity is the hallmark of incident management processes in enterprise IT, and an integral part of that process is reporting. Dan Ruehl, senior software implementation specialist for IZPCA at 21st Century Software, spoke recently at SHARE New Orleans on how to engage in more preventive capacity management processes to ensure businesses meet customers’ needs with little to no interruption.
Typically, disruptions to customer-facing applications automatically generate incident tickets from the help desk with business service names, but it can take time to identify, for example, which CICS transactions match those business service names. These disruptions rarely affect just one application, which is why capacity management is integral to the smooth operation of an enterprise’s mainframe system.
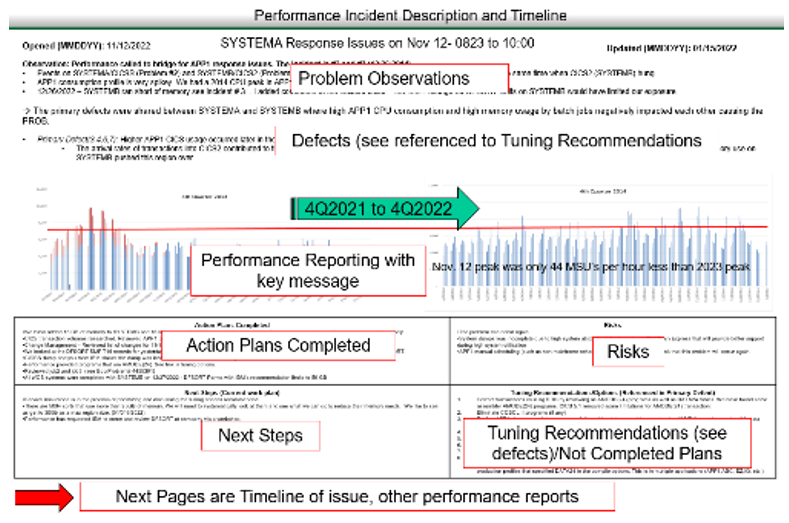
Initial incident responses should quickly return processes to service, and reports given to interested parties should equip them with the information they need to review their own applications’ past, current, and future state impact monitoring. Incident reports issued to stakeholders need to provide the specific time during which the problem initially happened and what were its first impacts; identify which application(s) were impacted; outline any previous, related incidents; call out any known changes; and indicate if the problem is still occurring. Problems’ root causes should also be documented, and copies of the findings should be maintained by both stakeholders and the capacity managers.
“Quick Focus” on Root Cause Within the First 30 Minutes (“The Wide Net”)
At the onset of the first incident, a wide net should be deployed to analyze the incident and what error has occurred. Incident analysis performance data should be made available within 15 minutes after the incident event. The goal is to have initial root cause analysis to the help desk or incident bridge quickly, so they can direct or assign incident resolution to resolvers.
What Process Speeds Incident Resolution?
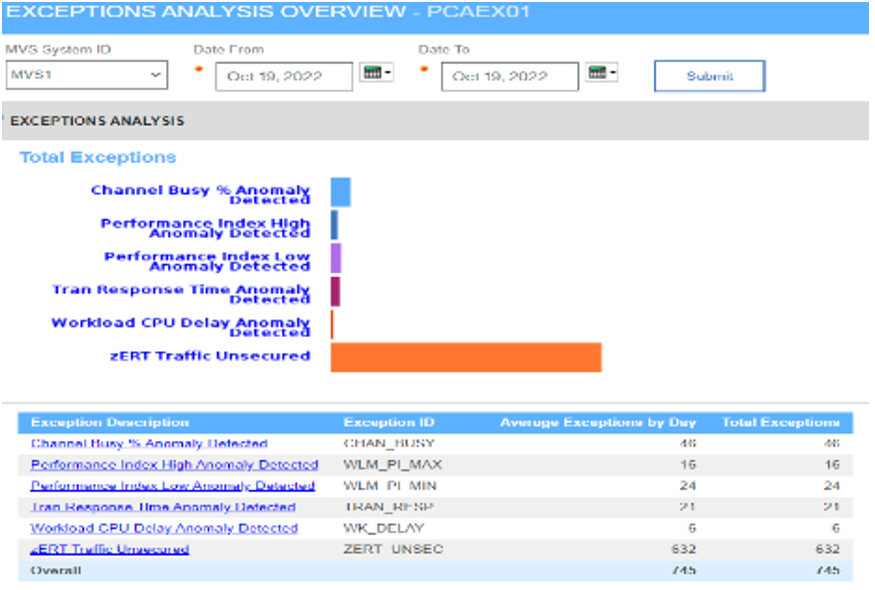
Start or create an incident timeline of the event using a wide net approach and review exception overview dashboards, including all static and dynamic alerting thresholds that should include infrastructure and application service thresholds.

The IBM Z platforms provide workload level statistics via z/OS Workload Manager (WLM) statistics, as well as system CPU and disk I/O statistics. All these statistics are better consolidated for “wide net” analysis.
A quick historical review of the time interval and workload performance is in order. The root cause owner should be notified for validation and review with this first phase of root cause analysis. After this first thirty minutes of analysis look deeper into the problem.
Delving Into the Root Cause
1. Look for other impacts in the enterprise.
Continue your deep analysis of the problem interval, which would include other work or transactions impacted by your initial findings or even the triggering cause. This could have generated more incident tickets.
2. Build more detail into your timeline.
Application reports should include an examination of whether response times grew gradually or only happened in the interval and whether other transactions had lagging response times. It is important to contact the batch or transaction owners and review other system reports within that first, 30-minute interval after the incident.
3. Step through the timeline with key scorecard measures.
Reviewing the key infrastructure measures, such as WLM and the LPAR measurements, may be either a cause or leading indicator of incident event. A health scorecard that covers a multitude of measures in the current day and previous intervals (did this happen before?) is critical for resolution and in preventing a future recurrence.
Preventive and Continuous Improvement
To achieve minimal business disruption and ensure all business services have the capacity necessary to operate effectively, the help desk and support teams need to know what business services are connected to which technical assets. Asset managers can help them make those connections by providing that information.
Historical and real-time data are also part of the equation, but data collection needs to be automated for better analysis at the disruption interval’s end. Additionally, a firm grasp of performance or service levels and scalability or capacity is needed to understand workload behaviors on the mainframe. When these aspects are detailed and understood, the cost of a “Stormy Monday” can be quantified.
Application Decisions and Strategic Measures Matter!
“Smart architecture decisions early on can decrease negative capacity, performance, and cost impacts,” says Ruehl. Each application’s development life cycle should be measured to prepare for and possibly reduce disruptions as applications are updated or replaced.

The continuous improvement process is effective when IT forecasts in IT departments and the overall enterprise align and are connected to business assets. Application and business forecasts and measures are critical data points that enable the business to be successful in meeting their customer service levels.
Memorialize “Stormy Monday”
Finally, memorializing the “Stormy Monday” problem or incident within an incident system and department records also ensures that capacity issues are remediated more quickly, but also will drive resiliency of the business service.

Prevention and continuous improvement will happen when application life cycles and capacity needs are focused on technical key metrics, but they also need to be understood and accounted for within the larger business operational context.
For more on capacity planning, check out our article on the Mainframe IT Role: Capacity Planning Analyst – Balancing the Scales of Enterprise Resources