Mainframes remain essential for processing high-volume transactions in industries like finance, insurance, and public services. However, they often lack real-time observability and integration with modern analytics platforms. Integrating IMS Connect with Apache Kafka and diagnostic tools is one way to enable real-time trace streaming and analytics.
IMS Connect serves as the communication bridge between TCP/IP-enabled clients and the IBM IMS (Information Management System) system, which encompasses both transactional and database functions. The integration of a trace and diagnostic tool with IMS Connect extends its capabilities by capturing granular operational data through event and transaction trace records. Historically, such trace information has been analyzed only after incidents occur, slowing down issue resolution. By incorporating Apache Kafka — a resilient and distributed event streaming platform — this approach enables immediate ingestion and analysis of IMS Connect traces.
Unexpected increases in transaction volume can strain IMS subsystems, leading to latency or potential failure. An integrated monitoring system that combines IMS Connect with Kafka and a trace and diagnostic tool can detect workload spikes early. By utilizing Kafka for trace ingestion and applying machine learning (ML) and statistical techniques, the system flags anomalies as they emerge. This empowers operations teams to act swiftly, redistributing workloads, scaling infrastructure, or activating rate limits. Additionally, analyzing long-term transaction trends can mitigate future spikes through proactive planning.
Another critical focus of the monitoring system is diagnosing failed messages, particularly those using the Open Transaction Manager Access (OTMA) protocol. Failures may result from timeouts, malformed requests, or backend inconsistencies. Real-time monitoring of failure patterns that is enriched with contextual data via Kafka Streams or Apache Flink enables classification of these events and supports rapid remediation. This approach significantly reduces mean time to resolution (MTTR) and strengthens overall system resilience.
Analyzing message throughput is equally essential for evaluating system performance. Tracking the frequency of OTMA messages helps identify potential underutilization or overload scenarios. For instance, a drop in throughput may indicate system degradation, while a spike could signal a transaction surge. When combined with anomaly detection techniques, these metrics enable intelligent scaling decisions and more efficient resource management.
Understanding client-specific performance is also a key priority. Metrics, such as request volume, response latency, and failure ratios per client, offer valuable visibility into usage patterns and service quality. These insights not only help identify high-traffic or error-prone clients but also form the foundation for behavior modeling using machine learning techniques. Such modeling supports the forecasting of future trends and enables targeted performance optimizations.
At the heart of the solution lies a robust real-time pipeline. IMS Connect can extract trace records from trace and a diagnostic tool, which are then parsed and sent to Kafka topics using producer applications. Streaming frameworks like Kafka Streams process this data for enrichment, filtering, and categorization. The output is then visualized using platforms like Tableau, offering dynamic dashboards for monitoring system behavior, transaction flow, and issue hotspots.
The monitoring system’s intelligence is further strengthened through predictive modeling, which enhances its ability to anticipate and respond to operational issues. This enables the IMS Connect to not only detect predefined conditions using deterministic rules, but also to identify previously unseen patterns and anomalies through machine learning techniques like time-series forecasting, clustering, and supervised classification are explored to uncover insights and automate anomaly prediction. Together, these approaches help proactively surface risks and reduce response times.
By combining the resilience of z/OS with the agility of Kafka-based streaming, organizations can unlock deep operational insights, minimize downtime, and elevate system responsiveness. This integration lays the groundwork for a new generation of intelligent mainframe monitoring solutions.
Enabling Real-Time Trace Processing with Kafka and IMS Connect
To support intelligent monitoring and machine learning, trace data from IMS Connect must be captured, streamed, and processed in real time. The following pipeline outlines how this is achieved using Kafka-based infrastructure.
To enable real-time observability and analytics, trace data from IMS Connect is continuously streamed through a Kafka-based pipeline. This architecture ensures scalable ingestion, processing, and enrichment of trace records, forming the backbone for anomaly detection, performance monitoring, and machine learning integration.
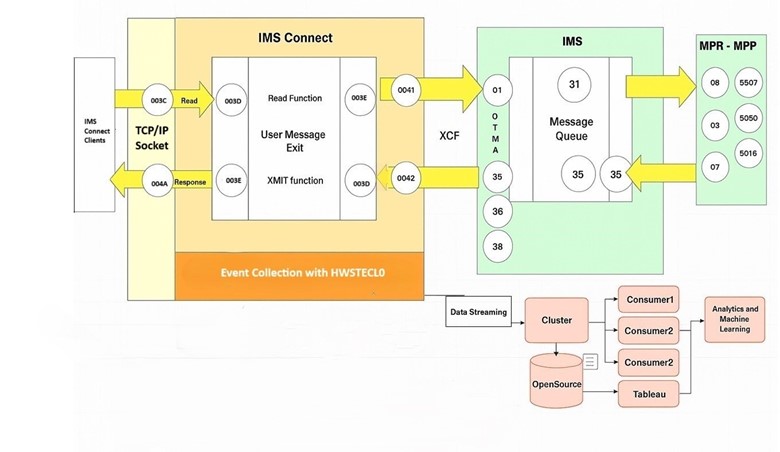
Figure: Trace and diagnostic tool with IMS Connect — records for streaming
- Data Ingestion: Trace records are collected in real time from a diagnostic tool integrated with IMS Connect, then normalized and prepared for Kafka ingestion.
- Kafka Cluster: The central streaming backbone buffers, partitions, and persists the incoming records, allowing for high-throughput data processing with fault tolerance.
- Stream Processing: Kafka Streams consumers process the data. Tasks include enrichment with metadata, filtering, failure classification, and performance metric computation.
- Visualization & Dashboards: The processed output is consumed by visualization layers that support live monitoring dashboards. These platforms offer dynamic rendering of spikes, failure patterns, and client metrics.
- Machine Learning Integration: The streamed data is also available to data science pipelines that apply anomaly detection and predictive analytics models.
ML-Powered Insights From IMS Connect Streaming Data
With a real-time streaming pipeline in place, IMS Connect trace data becomes immediately available for advanced analytics and machine learning applications. Integrating trace diagnostics with platforms like Kafka enables continuous alerting, anomaly detection, and predictive modeling — transforming raw operational data into actionable insights.
Machine learning enables IMS Connect trace analytics to move beyond reactive reporting. The following set of monitoring insights illustrate how ML techniques are applied to improve observability, resilience, and performance in real time:
1. Detecting Workload Spikes
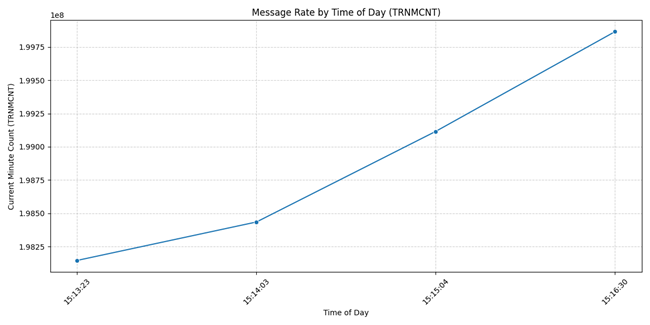
Figure: Detecting workload spikes — message rate/minute vs time
Transaction spikes can strain IMS, causing delays or failures. Real-time trace analysis enables immediate detection of such anomalies using statistical thresholds and ML models like isolation forests an unsupervised anomaly detection algorithm that identifies outliers by recursively isolating data points.,. Dashboards visualize these events, triggering alerts for quick response. Historical trends also support forecasting future spikes for better resource planning. Analysis of Failed OTMA Messages.
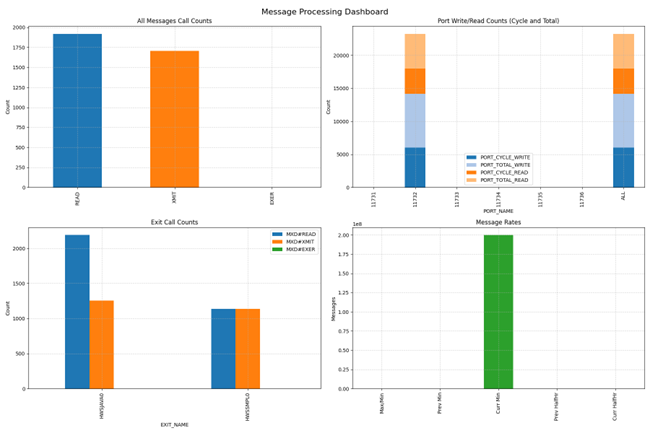
Figure: Failed OTMA message analysis
OTMA failures often signal systemic or client-specific issues like timeouts or malformed requests. Streaming and classifying these traces in real time using Kafka Streams or Flink enables error categorization and root-cause analysis. Enriched data supports failure dashboards, reducing MTTR and improving fault visibility.
2. Monitoring IMS Connect Message Throughput
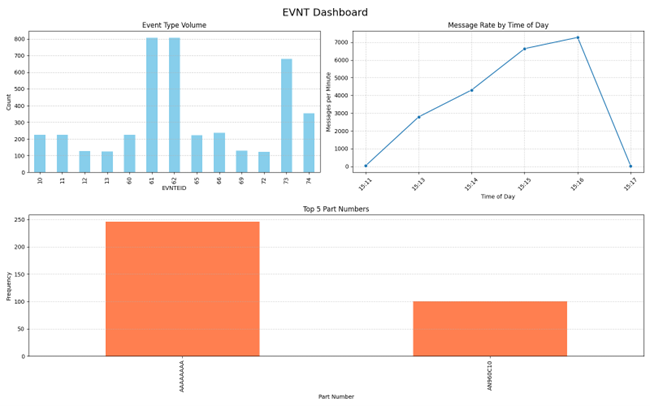
Figure: Real-time monitoring — IMS Connect message throughput
Analyzing OTMA message rates helps detect underutilization, overload, or bottlenecks. Time-series trends reveal drops indicating lag or spikes suggesting transaction floods. Combined with anomaly detection, this enables early capacity risk alerts and performance tuning.
3. Real-Time Client Behavior Analytics
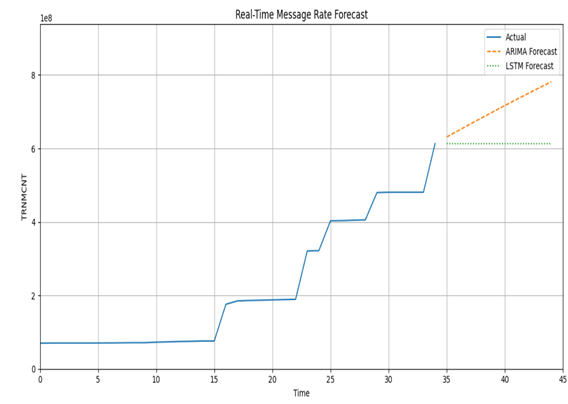
Monitoring client interactions with IMS Connect is key to Service Level Agreement (SLA)compliance and performance tuning. SLA compliance refers to how well a system or service provider adheres to the terms defined in a Service Level Agreement (SLA). Metrics like message rate and latency feed ARIMA (Auto Regressive Integrated Moving Average) and LSTM (Long Short-Term Memory) models to forecast trends — growth or stabilization. These forecasts, combined with clustering and anomaly detection, highlight abnormal usage, enabling proactive tuning and early issue detection. ARIMA is a statistical model used for forecasting time series data. LSTM is a type of Recurrent Neural Network (RNN), part of the deep learning family. It’s designed to remember information over long sequences.
Integrating IMS Connect with real-time streaming and analytics frameworks enables modern observability, predictive modeling, and operational intelligence. By unlocking trace data for active use, organizations can shift from reactive problem-solving to proactive, data-driven decision-making.
Bibliography and References:
- IBM Corporation, IMS Connect Guide, IBM Documentation: Referenced in IMS Connect architecture, message routing, and communication model
- IBM Corporation, IMS Open Database: Universal Drivers and Access Methods: Referenced in data access explanations and JDBC/DRDA-based communication setup.
- BMC Software, Inc., BMC AMI Energizer for IMS Connect 1.9 Documentation: Referenced extensively throughout the blog understanding Energizer’s message exits, workload governance, and diagnostic trace generation.
- Apache Software Foundation, Apache Kafka Documentation: Referenced in producer/consumer setup, topic design, and Kafka Streams processing.
Santosh Dorge is a lead product developer specializing in mainframe systems and enterprise modernization. He focuses on integrating IMS Connect with modern platforms like Kafka, REST APIs, and machine learning for real-time analytics. He holds a master’s degree in machine learning and data science and brings deep expertise in bridging mainframe systems with cloud-native technologies