This article is part of SHARE’s intro to the mainframe series. Read the articles on CICS, Automation, Catalogs, COBOL, Db2, and HSLAM. If you would like to contribute to this series, please reach out to editor@share.org.
Hybrid architectures have transformed how organisations build and run applications and business services. Today, a single customer request might begin in a mobile application, pass through an API gateway, travel across distributed systems, and eventually land on IBM Z.
For example, when a customer checks their account balance in a mobile banking app, the request travels through an API gateway, through cloud-based authentication services, connects to z/OS Connect, queries CICS for account data, and retrieves the balance from a Db2 database. Each component has its own tools and dashboards, and while they’re powerful on their own, they rarely show the whole journey of the transaction. When something slows down, the first question isn’t “What’s wrong?” It’s “Where do we even look?”
And in most organisations, “we” usually means different teams, for example, CICS, IBM MQ, Db2, z/OS operations, cloud, API, mobile, each working from their own data, their own dashboards, and their own assumptions.
For example, the Db2 administrator sees a slow query performance but doesn’t know what triggered it. The CICS team spots an increase in transaction volumes but can’t tell if the delay is upstream or downstream. The cloud team notices API latency but cannot tell what is happening once the request reaches the mainframe. Everyone sees their part of the request, but no one sees the whole picture. That’s how silos form and why resolving issues can take longer than it should.
This is where OpenTelemetry (OTel) comes in. OTel provides a unified, open approach to collecting and correlating telemetry data across cloud, distributed, and IBM z/OS environments. With a shared end‑to‑end view, teams can see where performance bottlenecks or errors originate and route the issue to the right team quickly, getting it fixed faster or even preventing a problem altogether.
Are you new to the mainframe? SHARE connects and educates mainframers from all career stages. Learn more and access resources.
What Is OpenTelemetry?
OpenTelemetry is a vendor‑agnostic, open‑source framework governed by the Cloud Native Computing Foundation (CNCF). It enables observability by defining open standards for three kinds of telemetry data (signals): metrics, logs, and traces. Semantic conventions ensure that telemetry emitted from cloud services and IBM z/OS systems can be interpreted consistently in any compatible observability backend.
Rather than trying to piece together siloed data, teams get a joined-up view of application health across the entire enterprise.
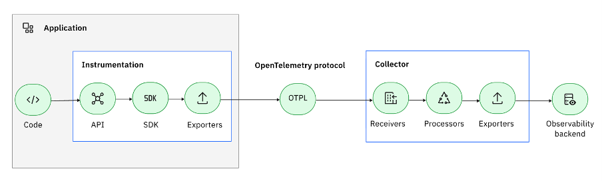
Figure 1: OTel architecture
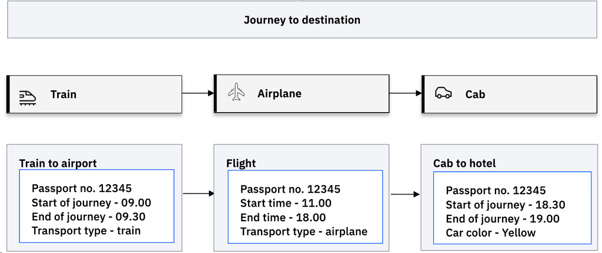
To understand how OTel represents a request or transaction, imagine planning a trip. You take a train to the airport, fly to your destination, and finish the journey by cab. Each segment matters, as problems can occur anywhere along the way. Your train might be delayed, your flight might be cancelled, or traffic might hold up your cab ride. To understand why you arrived late, you need to see all three legs together to identify which leg of the journey caused the delay.
Figure 2: Journey to a destination
Now let's apply this same idea to a distributed application where each component represents a stage in the journey. Just as you need to see all three legs of your journey to identify which segment caused the delay, you need visibility across your entire enterprise system to pinpoint where a request slows down or fails.
In OpenTelemetry:
• There is a single identifiable trace for the entire journey of a distributed application.
• Child spans represent the collected data for each leg of the journey.
• Context propagation keeps the journey connected as it moves from one system to the next.
Figure 3: Journey of a distributed application
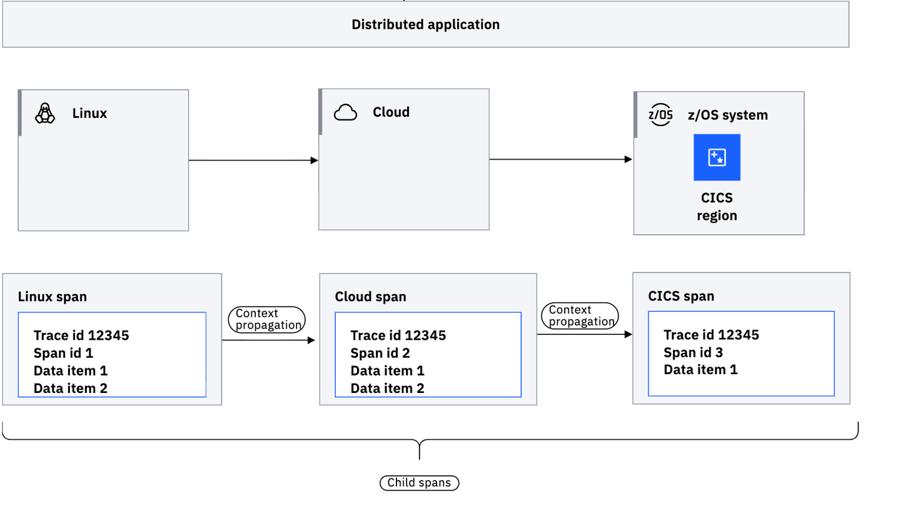
This model helps teams visualize exactly where time is spent and where delays occur.
Why This Matters for IBM z/OS
Many enterprise transactions follow a hybrid path. For example, a mobile request enters an API gateway, flows through distributed systems to z/OS Connect before moving to CICS, IMS, MQ, and Db2. Without a common telemetry standard, you can see parts of the journey but not the whole trip.
With OTel, IBM z/OS components can emit spans and propagate trace context, often without changing application code. The full end‑to‑end path becomes visible and teams can get the answers to key questions, such as:
- Where is the bottleneck?
- Is the issue with z/OS Connect, IBM MQ, or CICS?
- Can we observe and analyse the whole request path, not just parts of it?
What Are the Benefits and Drawbacks of OpenTelemetry?
OTel provides a standard way to collect and emit telemetry data from applications, but it doesn’t include built‑in tools for visualizing or interpreting that data. Instead, this is handled by an observability backend, which turns telemetry data into insights about application behaviour and performance. Because OTel is vendor‑neutral, the same telemetry can be used across different backend systems.
Jaeger is one example of an open-source observability backend that works with OTel data. It offers visualization and analysis tools for distributed traces, helping you spot and diagnose issues.
The fact that Jaeger is open source reflects the broader IT community's embrace of OpenTelemetry as a standard. Organizations worldwide are contributing to and adopting these tools to improve observability across their entire technology stack.
In the example shown in Figure 4, you can see how a single request generates multiple spans as it flows through the system. The trace begins with one client span (representing the initial request), which then triggers two CICS spans as the request is processed by CICS transactions. When an error occurs in one of these spans, it is marked with a red dot to highlight which part of the request path failed. This visual representation makes it easy to identify not just that an error occurred, but exactly where in the request flow it happened.
Figure 4: Illustration of CICS-emitted spans inside Jaeger

Expanding the error span in Jaeger provides access to more detailed information that can be used to aid in troubleshooting issues, such as the error type, server address, and port number. This information can then be shared with the relevant team to aid further investigation.
A span with an overly long duration indicates a request is experiencing a degraded response time. OTel tracing enables you to identify the location of the slow down easily. It’s worth saying that what counts as a “slow” span isn’t always obvious just from the number alone. Different parts of an application naturally take different amounts of time, so a long span isn’t automatically a problem.
What usually helps is comparing today’s span to what that same span normally looks like over time. If it suddenly takes much longer than usual, that’s a good sign something has slowed down. Traces make this easy to spot because you can see exactly which step in the request is behaving differently from its usual pattern.
In this way, OTel helps z/OS teams use the same formats and tools their cloud counterparts already rely on, cutting down troubleshooting time and improving shared understanding.
Where Does OpenTelemetry Fit Into IT and the Mainframe Landscape?
The OpenTelemetry ecosystem is rapidly expanding, with major vendors across the industry adding support for OTel standards. IBM, Broadcom, BMC, Rocket Software, and many others are either supporting or actively working to support OpenTelemetry in their observability and monitoring solutions.
This widespread adoption means that organizations can choose the tools that best fit their needs while maintaining a consistent approach to telemetry collection across their entire infrastructure.
As described in Figure 1, OTel’s architecture is built around three components:
- Instrumentation that produces telemetry data.
- The OpenTelemetry Collector, which receives and processes that data.
- An observability backend for analysis and visualization.
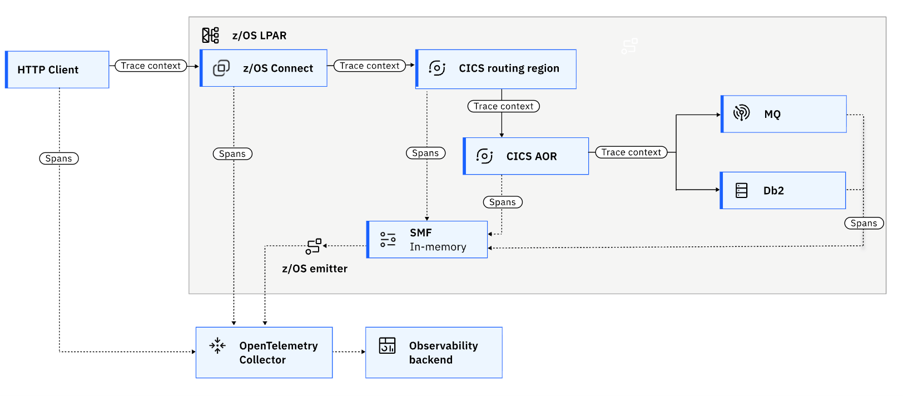
On IBM Z, z/OS Connect, CICS, IMS, IBM MQ, and Db2 can all emit spans, and CICS Java applications can be instrumented directly using the OTel SDK. Data flows through the Collector via OTLP and into backends like Instana, Jaeger, Prometheus, or others, as shown in the following diagram.
Figure 5: Example visualisation of spans and context propagation within a trace
How Do You Use OpenTelemetry?
Before implementing OpenTelemetry, it's important to understand your current observability landscape and choose an appropriate backend that meets your organization's needs. Once you've identified your observability backend, a phased approach works well.
- Review OTel’s trace model and semantic conventions.
- Choose one representative hybrid flow (e.g., API to MQ to CICS to Db2).
- Initiate a task containing OTel context.
- Enable span emission and context propagation in the relevant IBM z/OS components.
- Send the telemetry data to a collector that can forward it on to your chosen observability backend.
- Validate that a single, connected trace appears end‑to‑end.
- Expand, refine, and extend your visibility across more services.
How Would You Recommend Learning To Use OpenTelemetry?
Want to find out more? Get involved by joining the Mainframe Special Interest Group (SIG) community to stay updated on IBM Z-specific developments and contribute feedback or code to help shape mainframe observability standards.
Resources:
The image used in this article are adapted from IBM documentation and can be found here: https://www.ibm.com/docs/en/cics-ts/6.x
Learn More About OpenTelemetry:
Caroline McNamara is a technical content developer for CICS, specialising in user-focused documentation. She works closely with CICS development and users across the community to create clear, practical content that helps teams understand and adopt new capabilities on the platform. McNamara is passionate about making complex mainframe technologies accessible and leads initiatives that improve how users learn about and work with CICS.